Debugging Mosaic Frontend Samples
About
The deployed version of Mosaic Frontend Samples can be debugged using a browser.
This guide uses the Chrome browser to debug Sign-In With Email/Password scenario.
A similar procedure can be followed with a browser of your choice to debug any other scenario in the deployed version of Mosaic Frontend Samples Application.
Getting Started
-
Open Chrome browser and navigate to Mosaic Frontend Samples Application.
-
Create a profile in the application by following the Getting Started Guide if you have not done so already.
-
Open
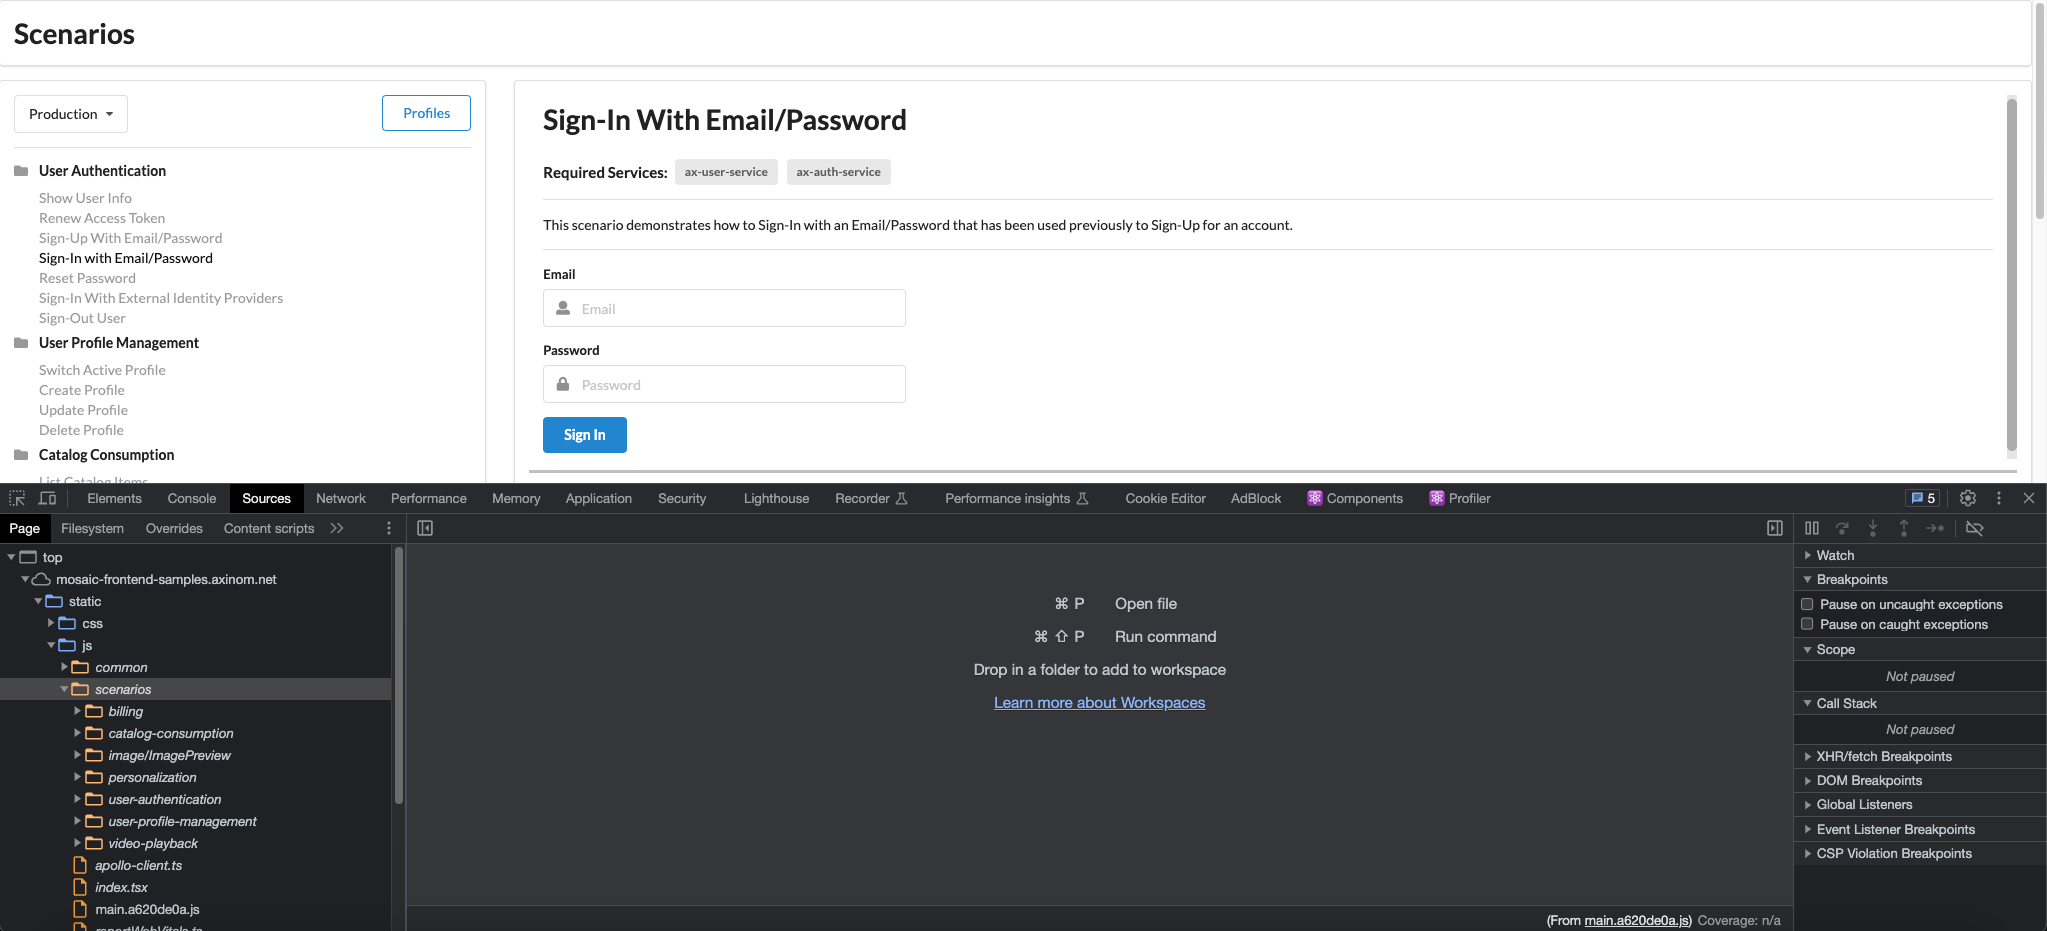
Sign-In With Email/Passwordscenario by selecting the corresponding entry from the list of scenarios. -
Open DevTools by pressing
Control+Shift+I(Windows/Linux) orCommand+Option+I(Mac). -
Select
Sourcestab in DevTools.
You can then use DevTools to view and debug the source code of the scenario.
Using DevTools to Debug
The Page pane in Sources tab shows all the resources that the Mosaic Frontend Samples Application has loaded. Expand mosaic-frontend-samples.axinom.net > static > js > scenarios to find the Typescript source code of the scenarios.
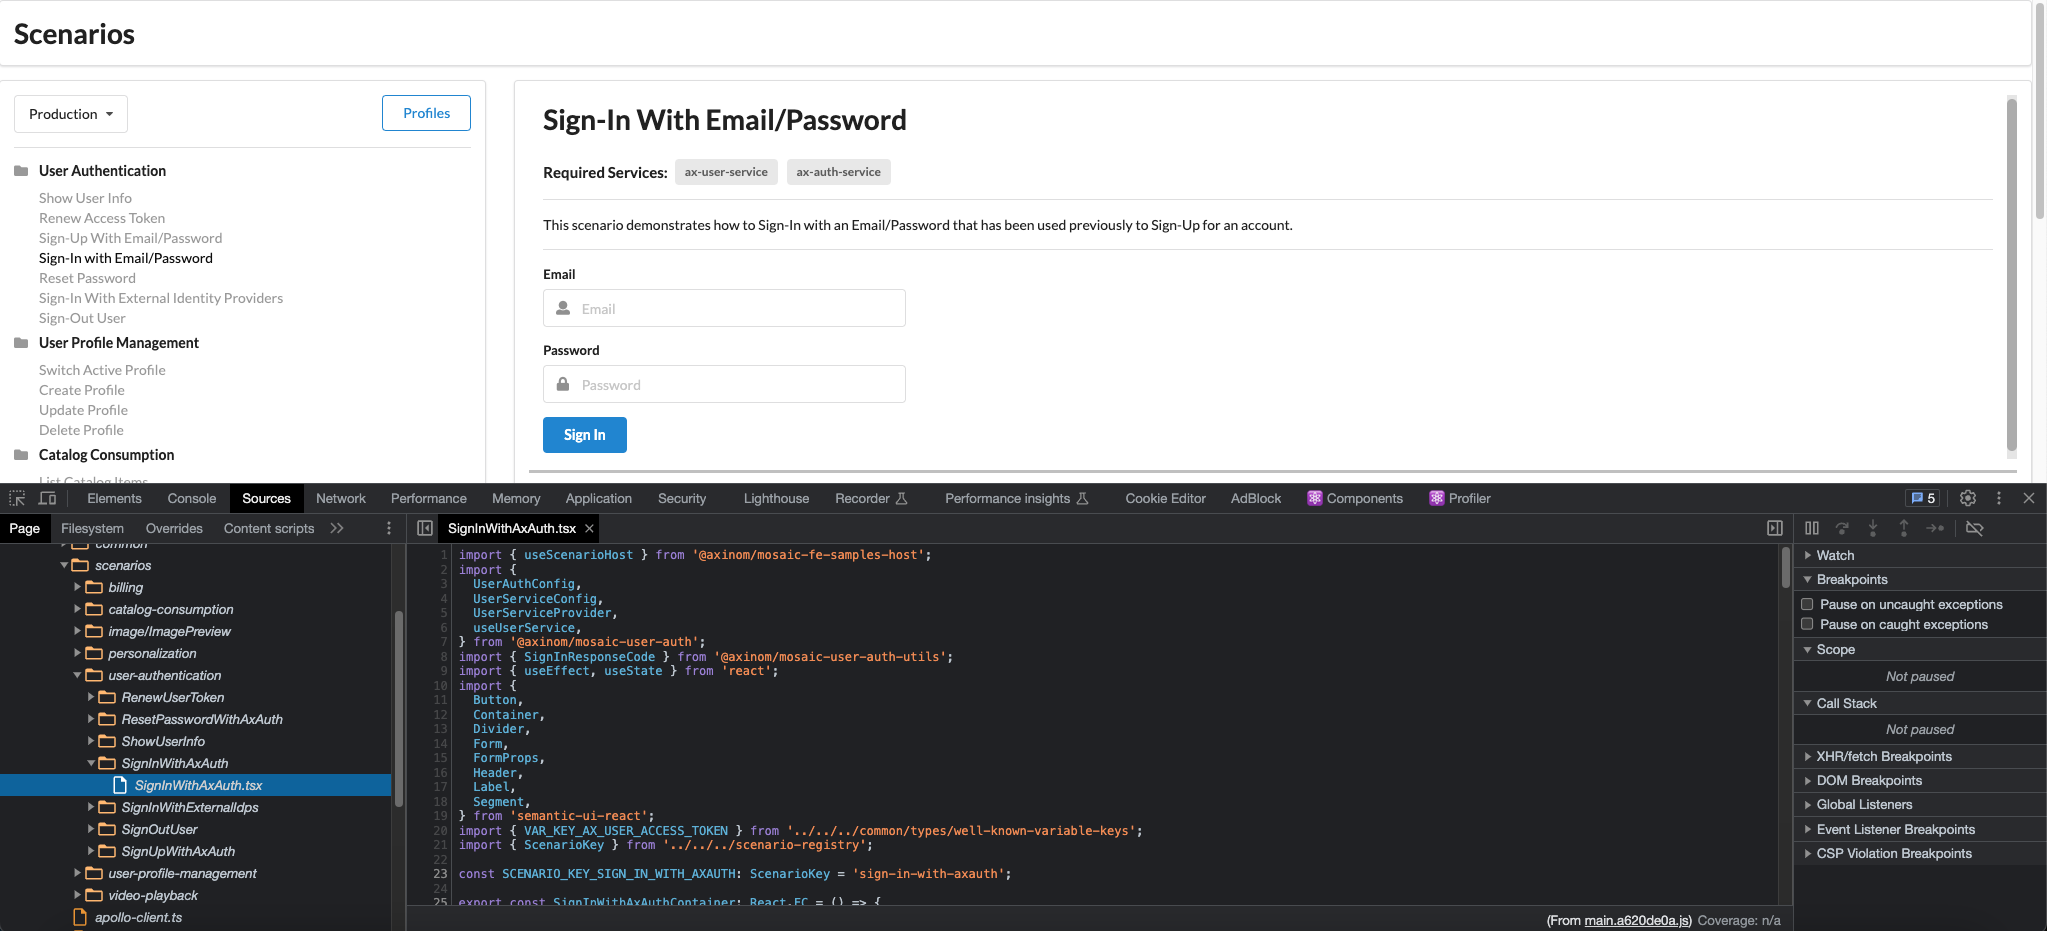
Source code of Sign-In With Email/Password scenario is located under user-authentication > SignInWithAxAuth > SignInWithAxAuth.tsx. Select this node to open the source code in the editor pane.
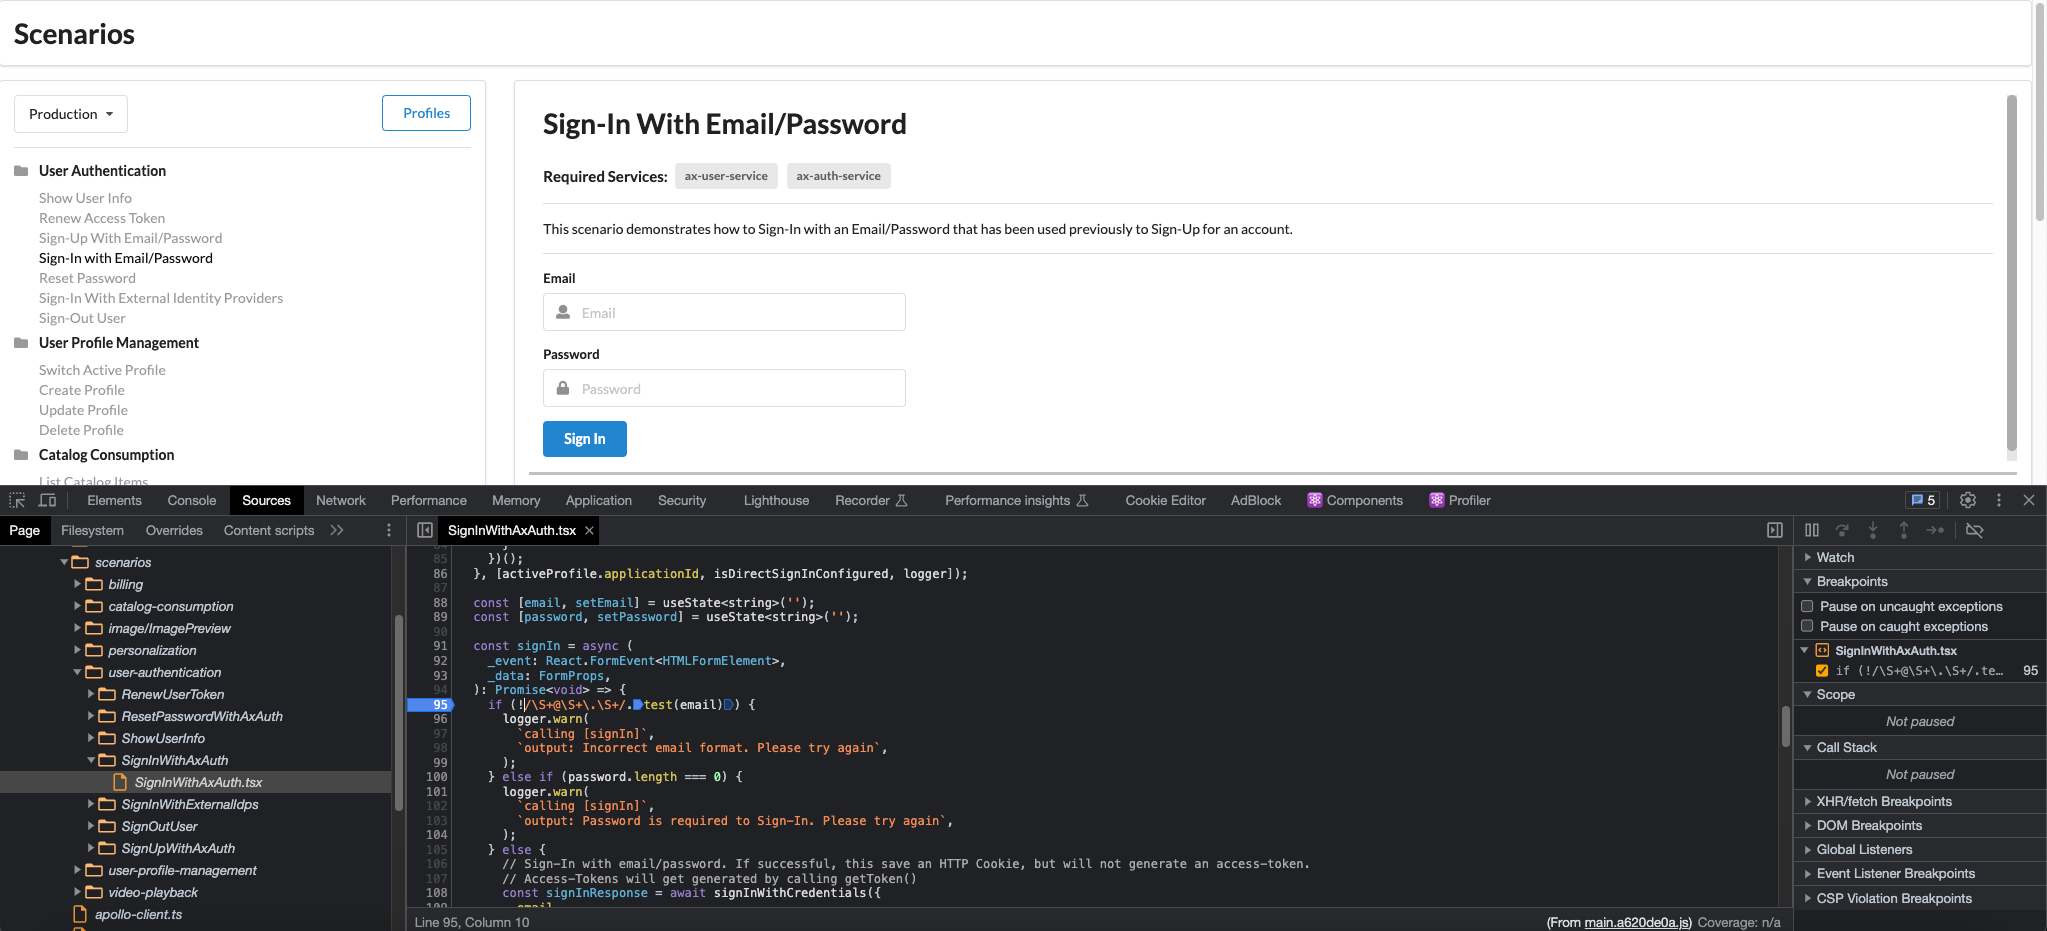
You can then place breakpoints in the code by clicking on the line number in the editor pane. signIn function gets invoked whenever the user clicks on the Sign In button. Place a breakpoint in the first code line of signIn function by clicking on the corresponding line number in the editor pane.
You can then enter an email and a password into the scenario and click on Sign In button. This should pause the code execution on the line of code where you added the breakpoint. You may then inspect the variables, call stack and step through the source code by using the following buttons:
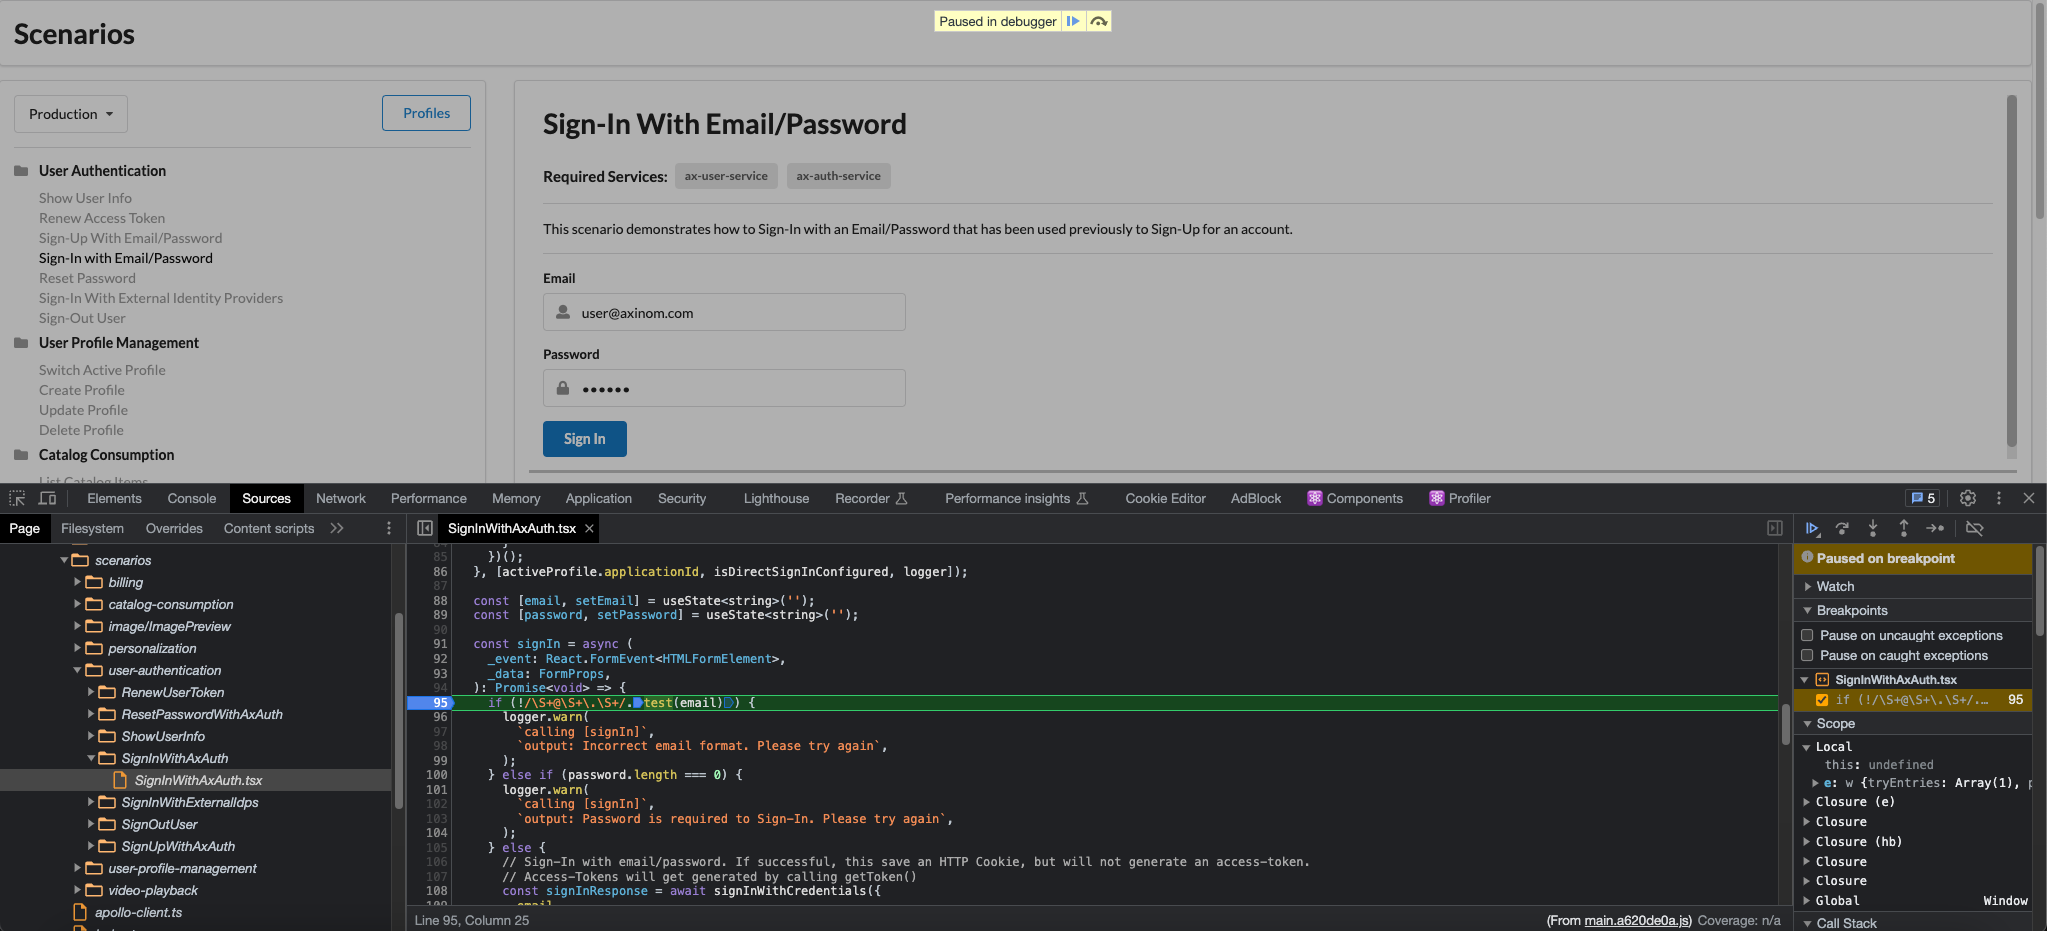
-
Resume script execution: resumes the execution of code until it reaches the next breakpoint.
-
Step over next function call: lets you execute the current line of code and move to the next line. If the current line contains a function call, the debugger will not enter that function and will simply move to the next line in the current scope.
-
Step into next function call: allows you to enter a function and continue executing the code line by line within that function. This is useful when you want to examine the inner workings of a specific function.
-
Step out of current function: used to execute the remaining lines of a function and return to the calling function. It helps you quickly skip through the code within a function and return to the higher level of execution.